
RESOURCES

Intro to NanoString
GeoMx® DSP stands at the powerful intersection of tissue imaging technology and genomic sciences. It enables investigators to finely dissect the fundamental features of any tissue and ask critical questions concerning tissue organization, cellular interactions, and disease pathology.
Learn more about NanoString at www.nanostring.com!
Tools & Technologies
GeoMx developer platform - Get started with the NanoString platform
See what other analysis methods have been developed for GeoMx DSP data
Dataset
For this hackathon participants will have access to a kidney dataset profiling specific regions to better understand the changes that occur during kidney disease development. This dataset consists of three normal tissue samples and four samples with diabetic kidney disease. High resolution slide images and corresponding spatially resolved gene expression data for selected regions of interest (ROIs) on the slides will be available.
Gene expression within each ROI was profiled using the Human Whole Transcriptome Atlas (WTA) from NanoString which captures expression from 18,000+ human protein-coding genes on the GeoMx DSP by tagging unique gene sequences physically within the tissue and then releasing specifically within the ROI areas.
Start with the README and then download the fully annotated dataset HERE!
Inspiration
Diabetic kidney disease is a type of kidney disease caused by diabetes. Diabetes is the leading cause of kidney disease. About 1 out of 3 adults with diabetes has kidney disease.
Scientists are trying to better understand the changes that occur during kidney disease development. GeoMx DSP enables a unique way for scientists to analyze these changes by providing gene expression in spatial context. Each study generates large amounts of data associated with multiple images creating challenges for scientists to interpret and derive biological conclusions.
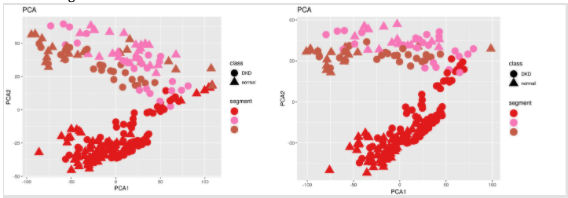
As an example, we can use PCA to visualize the separation in anatomical structures such as tubules vs glomeruli:
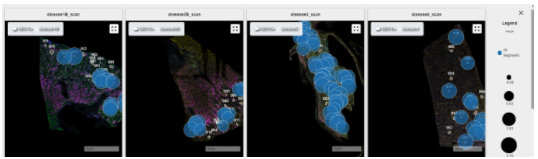
An example of using spatial information in conjunction with gene expression results:
See what else people have used the GeoMx data with previously:
- Featured Project: Illuminating the Transcriptome: Design and Technical Performance of Whole Transcriptome Atlas for GeoMx Digital Spatial Profiler - Fropf, R., AGBT 2021
- Featured Project: Hiding in plain sight: Topological analysis links local expression dynamics with spatial heterogeneity using the GeoMx® DSP Platform - Tyler, H., AGBT 2021
- High-throughput immune cell phenotyping using GeoMx DSP reveals Non-Small Cell Lung Cancers (NSCLC) are divided into distinct immunological subtypes. - Kim, Y., AACR 2020
- Pathway enrichment analysis of gene expression data from formalin fixed paraffin embedded (FFPE) samples using the GeoMx® DSP Platform. - Reeves, J. - AACR 2020
- Performance of GeoMx CTA and WTA, high-plex, spatial gene expression profiling tools. Sorg, K., AMP 2020
- Updating immune cell deconvolution for the spatial genomics era. - Danaher, P., AGBT 2020
- Spatial Landscape of the Immune Microenvironment in Metastatic Prostate Cancer using GeoMx Digital Spatial Profiler - Nelson, P., AGBT 2020
- Measuring the Spatial Whole Transcriptome on FFPE specimens Using Digital Spatial Profiling: Analysis of Patients with Glioblastoma Multiforme Treated with Neoadjuvant Anti-PD1 Immunotherapy - Lu, Y., ABGT 2020
- Localizing and quantifying tumor microenvironment (TME) contexture of human glioma with GeoMx® high-plex RNA profiling - McEachron, T., AGBT 2020
- Spatially-resolved measurement of intratumoral TCR diversity in Melanoma with the GeoMx® Digital Spatial Profiler - Swarbrick, A., AGBT 2021
Support